
|
Democratic Presidents Manage the Economy Better Than Republicans
- Ten of the last eleven recessions have occurred under Republican Presidents.
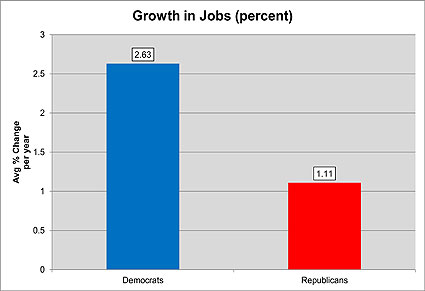
- Democratic presidents create more than twice as many jobs per year as Republican Presidents.
- Republican presidents' deficits are 9% higher as a percent of GDP.
- GDP grows 44% faster under Democratic Presidents.
- Business investment has grown more than twice as fast under Democratic Presidents than under Republican Presidents.
- RealClear Politics Commentary (11/15/23): Democrats Score Better on the Economy. Are Voters Listening?
- Forbes Guest Post (11/7/16): The Economy Does Better Under The Democrats
|
 |
Data updated for 2023 - Click on a chart to see the facts
|
 |  |
 |  |
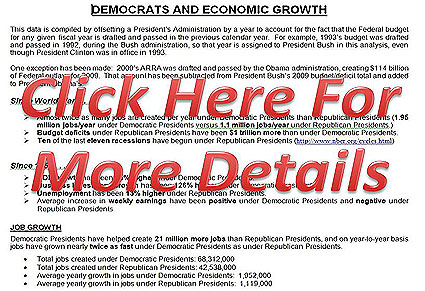
DEMOCRATS AND ECONOMIC GROWTH
Since World War 2
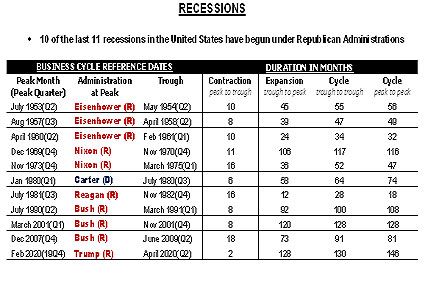
- Ten of the last eleven recessions have begun under Republican Presidents
- Since WW2, The US Economy has been in a recession for nearly 10 times as many months under Republican Presidents versus Democratic Presidents (113 months vs 11 months)
- More than twice as many jobs are created per year under Democratic Presidents than Republican Presidents (2.1 million jobs/year under Democratic Presidents versus 828,000 jobs/year under Republican Presidents.)
- Budget deficits as a percentage of GDP under Republican Presidents are collectively 9% higher than under Democratic Presidents
Since 1961
- GDP growth has been 44% higher under Democratic Presidents.
- Business Investment Growth has been 132% higher under Democratic Presidents.
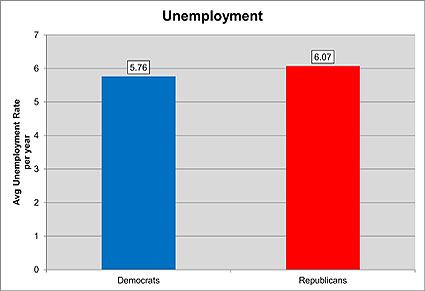
- Unemployment has been 5% higher under Republican Presidents.
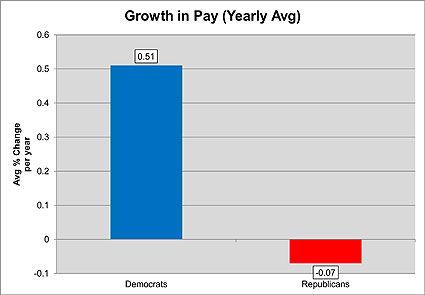
- Average increase in weekly earnings have been positive under Democratic Presidents and negative under Republican Presidents
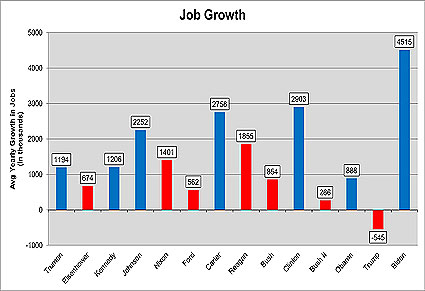
Job Growth
Democratic Presidents have helped create 43.8 million more jobs than Republican Presidents, and on year-to-year basis jobs have grown more than twice as fast under Democratic Presidents as under Republican Presidents.
- Total jobs created under Democratic Presidents: 76,948,000
- Total jobs created under Republican Presidents: 33,132,000
- Average yearly growth in jobs under Democratic Presidents: 2,080,000
- Average yearly growth in jobs under Republican Presidents: 828,000
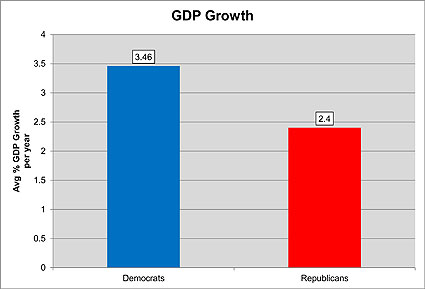
GDP Growth
Real Gross Domestic Product growth under Democratic Presidents has been 44% higher than during Republican Presidents.
- Average GDP growth per year under Democratic Presidents: 3.46%
- Average GDP growth per year under Republican Presidents: 2.4%
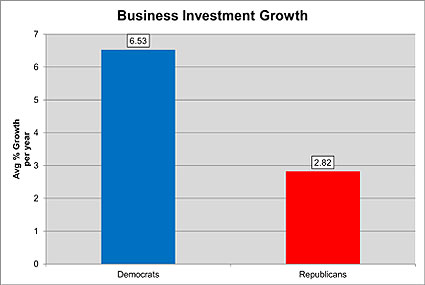
Business Investment Growth
Real business investment growth under Democratic Presidents has been 132% higher than under Republican Presidents.
- Average growth per year under Democratic Presidents: 6.53%
- Average growth per year under Republican Presidents: 2.82%
Federal Budget Deficits
Federal budget deficits as a percentage of GDP under Republican Presidents are collectively 9% higher than under Democratic Presidents.
- Democratic Presidents' deficits averaged 2.46% of GDP per year
- Republican Presidents' deficits averaged 2.69% of GDP per year
Unemployment
Unemployment under Republican Presidents has been 5% higher than under Democratic Presidents.
- Average unemployment per year during Democratic Presidents: 5.76%
- Average unemployment per year during Republican Presidents: 6.07%
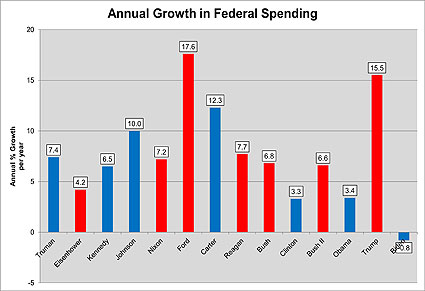
Growth In Spending
Federal Spending has increased 221% faster under Republican Presidents than under Democratic Presidents
- Democratic Presidents' annual spending increased by an average of $38.2 billion per year
- Republican Presidents' annual spending increased by an average of $122.6 billion per year
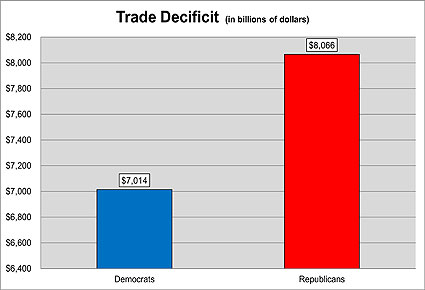
Balance of Trade
Trade deficits under Republican Presidents have been 15% higher than under Democratic Presidents.
- Total trade deficit under Democratic Administrations (in millions): $7,013,688
- Total trade deficit under Republican Administrations (in millions): $8,065,847
*Jere Glover has been collecting and publishing this data since 1980, 21st Century has been publishing the data on its website for 10 years.
|
|
 |  |
 |  |
 |  |
 |
 |
|
Data compiled here come from official government sources such as Statistical Abstracts of the United States, the Economic Reports of the President, and the US Census Bureau.
Contact: Jere Glover, 21st Century Democrats, jerewglover@msn.com
|